Writing code in text editors can quickly get tiresome, so here we look at an IDE that offers continuous compilation, contextual auto-complete, and a debugger!
The F4 IDE, written by Xored and maintained by Fantom Factory, is a great tool for developing Fantom code but may look a little scary to the uninitiated.
This article guides you through the process of creating your first Fantom project, and then running and debugging it, all the while explaining essential F4 and Fantom concepts along the way.
F4 is an eclipse workbench created from the 4.9 (2018-09) release. So if you need to google for answers, note the answer may be related to eclipse and not specifically F4.
Note the source code is freely available on GitHub. This is also a good place to report any issues and bugs found.
- Install
- First Run
- First Glimpse
- First Project
- Adding an External Interpreter
- Where's My Pod?
- Running Fantom Scripts
- Debugging Fantom Scripts
- Handy Shortcuts
Install
F4 requires Java 8 or later - so make sure you have a relevant Java JRE installed.
Then download the relevant version of F4 .zip file from the "Releases" tab in GitHub (~158MB):
Unzip it in the usual place for your apps / OS. All examples in this article will be using Windows: C:\Apps\
If you have a choice of 32bit or 64bit versions of F4, make sure it matches the 32bit or 64bit version of your installed Java.
Make sure that if you are using the 32bit or 64bit version of Java, that you are using ther same 32/64bit version of your Java JRE.
If you have multiple versions of Java installed, or if you get an error when starting F4, make sure F4 is picking up the correct JRE. Do this by editing F4.ini (a text file inside your F4 folder) and specifying a -vm option that points to where the java.exe lives. For instance, I add the following just before the -showsplash line:
-vm
C:/Apps/Java/openjdk-1.8.0_101/bin
Adjust yours to point to the correct java file.
See eclipse.ini - Specifying the JVM for more details.
F4 comes bundled with its own embedded Fantom 1.0.74 runtime, so does not require Fantom to be installed on your system. That said, it is useful to have your own Fantom installation because it is easier to customise and you can re-use it outside of F4, like on the command line.
So go ahead and also install Fantom, I'll explain how to tie it into F4 later. We will also need it later to copy over some example source files.
First Run
In Windows you launch F4 by running F4.exe
The first time F4 is run it will ask you for a Workspace location.
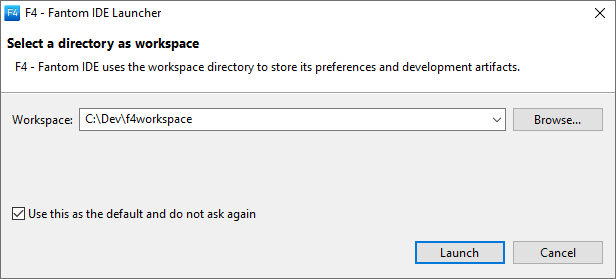
The workspace is used to store settings, preferences and dialogue histories. They are all kept nicely hidden inside a .metadata/ directory. The workspace is also a default area that F4 looks for and creates projects, though projects don't have to be kept there.
First Glimpse
Okay, here's my 30 second overview of an eclipse workbench:
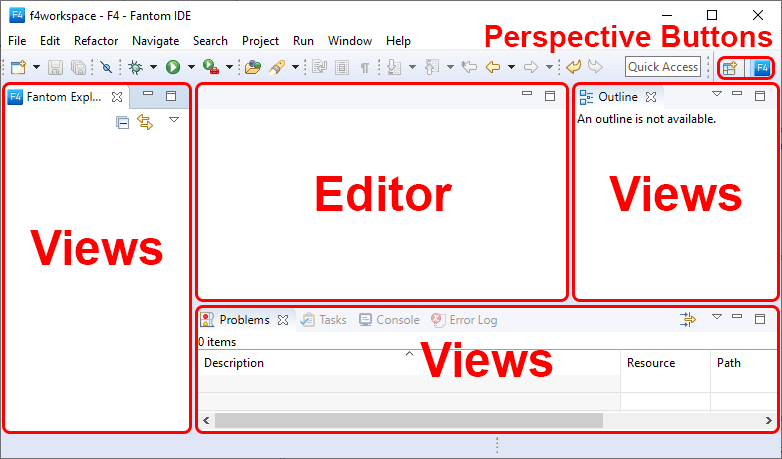
Files are edited in the Editor area. All other sections are called Views.
Views may be freely dragged and docked to all areas of the workbench. You can even close Views. To re-open a closed view, go to Window -> Show View -> Other. Important Views are:
- Fantom Explorer - A tree view of your projects.
- Problems - Shows compilation errors.
- Console - Shows the output of programs you run.
- Script Unit Test - Shows unit test results.
- Tasks - Shows all TODOs and FIXMEs
All those views are pretty generic and standard for eclipse.
The arrangement of open views and their docked location is called a Perspective. The perspective changes depending on what you're doing. For example, there's a dedicated perspective for debugging and a dedicated perspective for syncing code (via SVN, Hg, git, etc...). Most of your time is spent in the Fantom perspective.
For more detailed information on how to use the eclipse workbench, see the official Eclipse Workbench Basic Tutorial.
First Project
F4 does not really deal with individual Fantom files, but rather Fantom projects. More specifically it builds Fantom pods. One F4 project builds one Fantom pod.
Pods are to Fantom, as Jars are to Java, and Gems are to Ruby. If you don't know what pods are, or how to build them, then read:
- Inside a Fantom Pod
Inspects the contents of the BedSheet library (pod) to see what it contains.
- Inside a Typical Fantom Build Script
Explains how a typical Fantom build script works by inspecting the one used by BedSheet.
We're going to create an F4 project that builds a pod called examples.pod. It will contain the Fantom sys and fwt examples.
We are not going to compile all the examples into a pod because some of the examples share the same class and / or file name. In a Fantom pod all the .fan files must have different file names, and all the class names must also be different. (As explained in Inside a Fantom Pod.)
An F4 project is defined by 3 configuration files in the project's root directory along side the build.fan file. They are:
.buildpath(optional).classpath(optional).project
Yes, all the filenames start with a dot! This is so F4 hides them (by default) from the Fantom Explorer View.
File -> New -> Fantom Project will start the New Project Wizard whose main output is creating those files, and a basic build.fan. Enter a project name of Examples and click Finish.
Hooray, Your project has now been created!
Ah, but you may have noticed the one warning in the Problems View stating that the project has no source code:
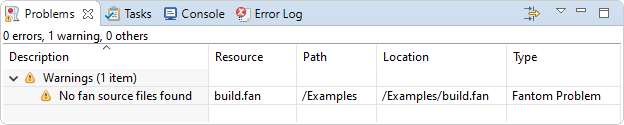
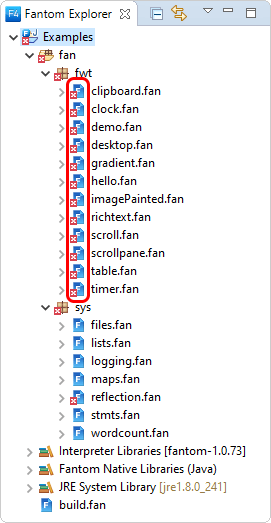
Lets correct this. Assuming you've installed Fantom, copy the following Fantom directories to the Example project's fan/ directory. (By convention all Fantom code is put inside a top level fan/ directory.)
%FAN_HOME%/examples/fwt
%FAN_HOME%/examples/sys
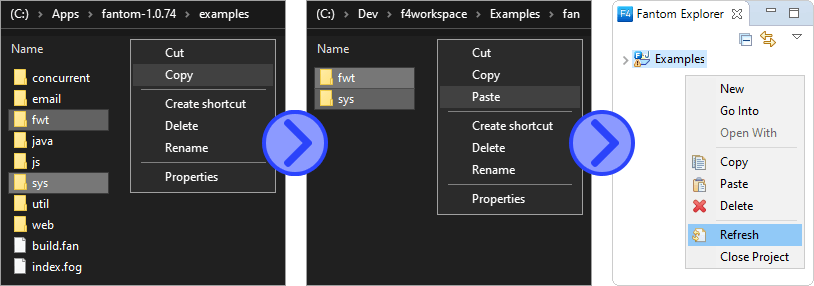
Once copied, F4 does not pick up the new files straight away as it maintains a cache of the file system. To force F4 to update, right click on the project in the Fantom Explorer View and select Refresh (F5).
Argh!!! Errors!!!
Not to worry. The Problems View tells us:
Using 'fwt' which is not a declared dependency for 'Examples'
To add a dependency, open the build.fan and edit the depends variable to add gfx, fwt, and concurrent:
depends = [
    "sys 1.0",
    "gfx 1.0",
    "fwt 1.0",
    "concurrent 1.0"
]
To understand the version syntax we've just added, see the Depends class. Note that sys 1.0 actually means sys 1.0.* so it happily matches the current Fantom version - 1.0.74.
Note that our pod is called examples - it's a Fantom convention that pod names start with a lowercase letter.
You may have noticed that F4, through some regular expression parsing magic, also altered and updated the srcDirs expression to add fan/sys/ and fan/fwt/. You can add, edit and delete whatever you like in build.fan, but leave the srcDirs line alone. Well, you can edit it if you like, but F4 will just change it back!
When you save a source file, F4 will re-compile the entire project and attempt to make a .pod file. So those errors won't go away until you hit save.
Note you can not run any code until ALL errors are fixed.
In F4, when you run a class as a script, it is run from the .pod file. If you have errors / red crosses in your project (check the Problems View) then the .pod can not be built, and you can not run any new code.
Adding an External Interpreter
F4 uses it's own compiler to compile Fantom code, but it compiles against the libraries found in the project's Interpreter. And when you run / launch classes, they too are run with libraries in the project's Interpreter.
F4 supplies it's own embedded Fantom 1.0.74 Interpreter by default. But this may be changed to use any Fantom installation. This is handy for installing custom pods and re-using Fantom environments.
First, unzip the Fantom version you wish to use. This example will use Fantom 1.0.74 unzipped to C:\Apps\fantom-1.0.74\
Then in F4 go to Window -> Preferences -> Fantom -> Interpreters. Then click Add... to bring up the Add Interpreter dialogue.
Click Browse... on the Interpreter Executable line and navigate to where the fan.bat is located in the Fantom installation. This should fill out all the fields as follows:
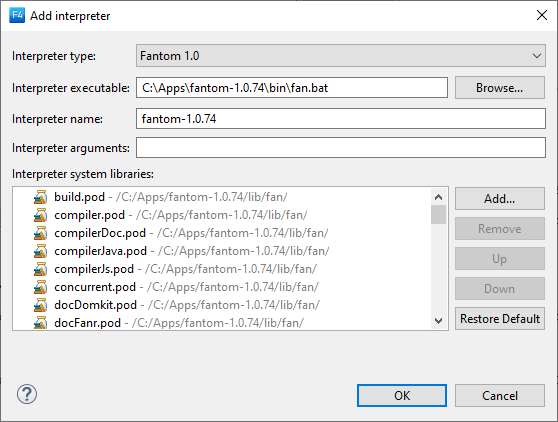
Click OK and it will be added to the list of Interpreters. Make sure that the newly added Fantom 1.0.74 (the non embedded one) is checked - this makes it the default interpreter for all projects.
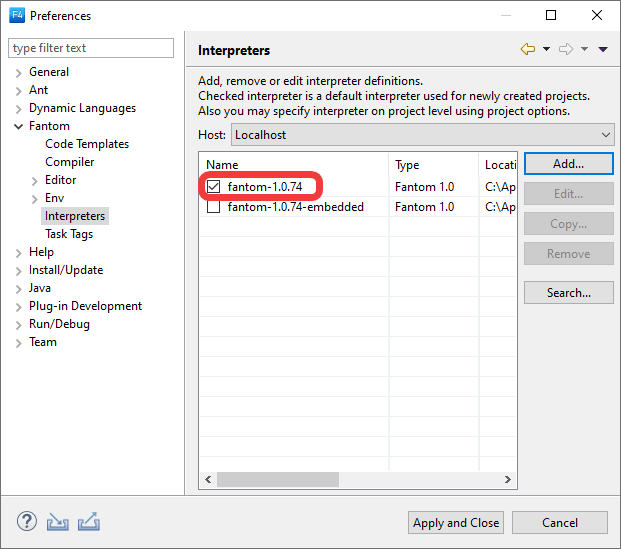
Click OK. If your project is not rebuilt goto Project -> Clean... -> Clean all projects to force a rebuild.
Where's My Pod?
If the Problems View is clear, the examples.pod should be built. But where is it? By default, output directories are hidden in the Fantom Explorer View, but if you use a normal file explorer you should find it here:
<project-dir>/bin/examples.pod
Right click on the project, select Properties -> Fantom -> Compiler and note the Pod output dir:
bin/
To test the rebuild, delete the .pod file, or the bin/ directory. Then clean the project, Project -> clean... and you should see the re-generated examples.pod file.
If the pod does not get re-built, then you have an error in your F4 project.
Running Fantom Scripts
Given our project is building, we should be able to run any class as a Fantom script.
Right click on any of the example .fan files, in either the Fantom Explorer View or the Editor, and select Run As... -> Fantom Class. Output from the program should appear in the Console View.
When you run a class in F4, it creates a Run Configuration. To see and edit run configurations, click the Run As button in the toolbar, or right click a fantom file and go to Run As -> Run Configurations....
To quickly access and run a recent configuration, click the down chevron next to the Run As button on the toolbar. (It looks like a white arrow in a green circle.)
Debugging Fantom Scripts
Let's try debugging a Fantom script. We'll debug lists.fan in the sys directory.
Open up lists.fan, find the search() method. We want to inspect the value of the x, y, z variables.
Double click in the left hand margin on one of the show methods and a blue ball should appear. Well done, you've just created a breakpoint. Now right click the editor and select Debug As -> Fantom Class.
A dialogue should appear asking if you want to switch the Debug perspective. Click Switch.
The program should run, printing stuff out to the Console View but stop when it reaches the breakpoint:
Note how our x, y, z variables DO NOT appear in the Variables View!
That's because, by default, Fantom does not generate any debug info. Let's change that.
Click the red square in either the Debug or Console View to terminate the program. Then close down F4.
Go to where the external interpreter is installed and open up %FAN_HOME%/etc/sys/config.props. Find the line with // debug=true and uncomment the line be removing the // so the line is now just debug=true:
// If debug is set to true, then the runtime emits debug
// information such as the LocalVariableTable for debuggers
// This property can only be configured by bootstrap homeDir.
debug=true
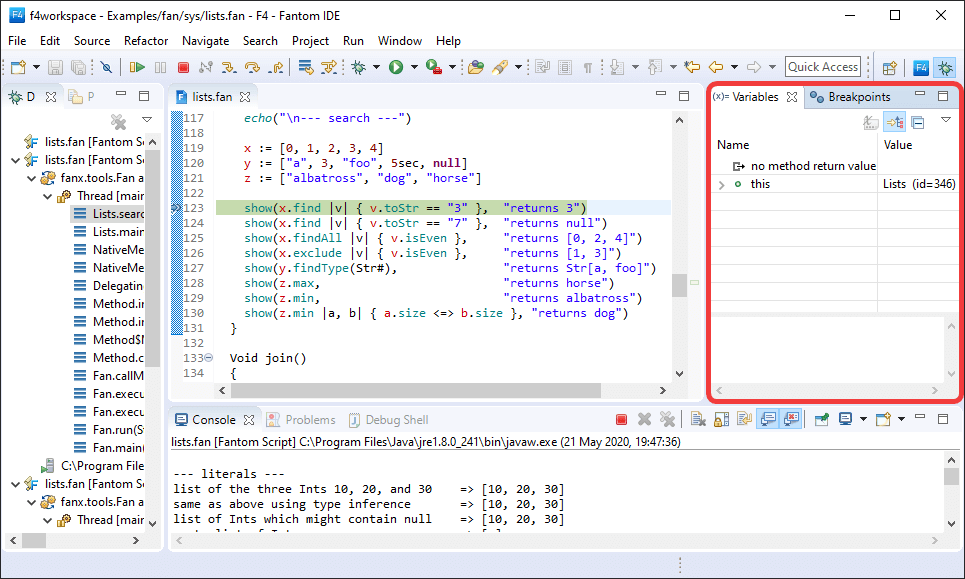
Save config.props, restart F4 and clean the project to force the .pod to be rebuilt; this time with debug info! ( Project -> Clean... ) The breakpoint in lists.fan should still be in the same place so Debug As -> Fantom Class.
When the program stops you should now see variables in the Variables View:
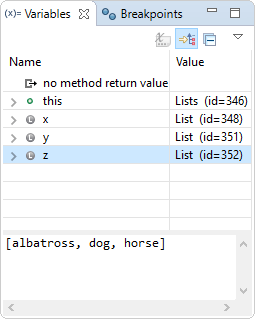
That looks much better!
Note that to go back to normal Fantom editing, click the Fantom Perspective button in the top right. (Remember to stop debugging / terminate the program first!)
If you see this message in the Variables tab:
com.sun.jdi.InternalException: Got error code in reply:35 occurred while retrieving value.
Then simply switch to a different tab, such as the Breakpoints tab, and then back to Variables. You should now see your variables as desired.
It is caused by debugging a Java 8 program. To get around it (if tabbing in and out is too much), install an earlier Java version such as JRE 6 or 7 and set that as your project's JRE System Library.
Handy Shortcuts
Following are some handy keyboard shortcuts that I find myself using all the time.
F3 ................. => Go to source file / definition
Alt + Up/Down ...... => Move current line up / down
Ctrl + Space ....... => Auto-complete / list alternatives
Ctrl + D ........... => Delete line
Ctrl + H ........... => Search for text in files
Ctrl + / ........... => Comment / uncomment selection
Ctrl + Alt + A ..... => Toggle Block Selection Mode
Ctrl + Alt + Up/Down => Copy and paste line (or selection) above or below
Ctrl + Shift + T ... => Open Fantom Type
Ctrl + Shift + R ... => Open file / resource by name
Ctrl + Shift + G ... => Find occurrences of Type / Method / Field
Have fun!
Edits
- 21 May 2020 - Updated content and screenshots to relate to Fantom 1.0.74 (from 1.0.69) and F4 1.1.4 (from 1.1) - by Mike Puckett.
- 23 June 2017 - Created a 15 minute video screencast for YouTube.
- 28 August 2016 - Updated to relate to F4 v1.1 (from v1.0.2).
- 28 August 2014 - Original article.